View Grid Reporting dashboards
This topic explains how to access Grid Reporting dashboards and work with reports, filters, and views to explore screening and operational data.
Use Grid Reporting dashboards to monitor trends, review activity, and understand screening outcomes across accounts and operations.
Prerequisites
To access these features, your company must subscribe to Grid Reporting dashboards, and you must have dashboard permissions assigned to you.
View dashboards
From either xeu.maxsight.com or xus.maxsight.com, log in with your Grid Reporting user name and password. If you do not know which URL to use or don't have login credentials, contact your organization's administrator.
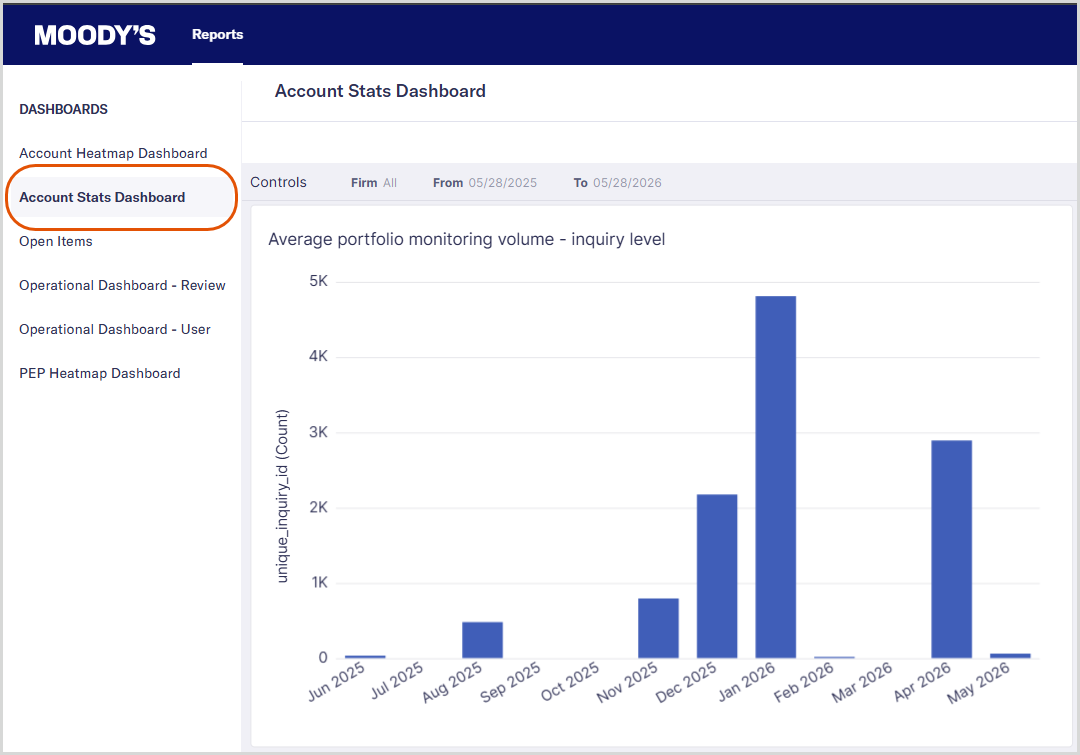
Select a dashboard from the navigation menu and wait for the dashboard data to load. Each dashboard contains multiple visual reports, such as tables, bar charts, pie charts, or heatmaps.
Hover your mouse over a report to view more details and options.
Use your keyboard’s key to navigate through reports, details, and options.
See the Grid Reporting dashboards and reports topic for information about individual dashboards and their reports.
Work with dashboard-level settings
Grid Reporting provides options to control how data is displayed across reports in a dashboard or to save a snapshot of the dashboard data.
Filter dashboard data
Filters help you narrow the data shown across all reports in a dashboard.
Select the arrow in the Controls bar on your dashboard to expand the filter options.

Adjust the available filters, such as date range, firm, country, or event type. Available filters vary by dashboard.
Review the updated reports. Reports refresh automatically based on your filter selections.
Click the arrow again to close the filter menu.
Export a copy of the dashboard
To print or save a copy of the dashboard with your filters applied:
Select the icon available near the dashboard header.
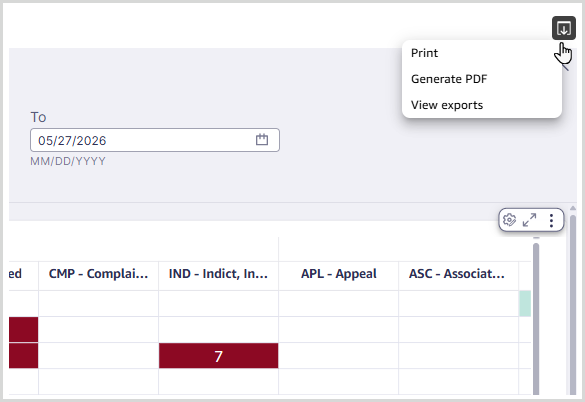
Select to print a copy of the dashboard, or select to save a copy to your computer.
When the success notification displays, select to retrieve your export file. You can also access your export files at any time by selecting from the menu.
Work with report‑level settings
Use report‑level settings to adjust or analyze an individual report without affecting the other reports in the dashboard. The report-level settings available are specific to each report.
Access report settings
To open the report settings menu, hover your mouse over a report or use to select a report. The menu displays automatically. Depending on the report, this menu may provide controls to adjust the view, sort the data, or define customizations.
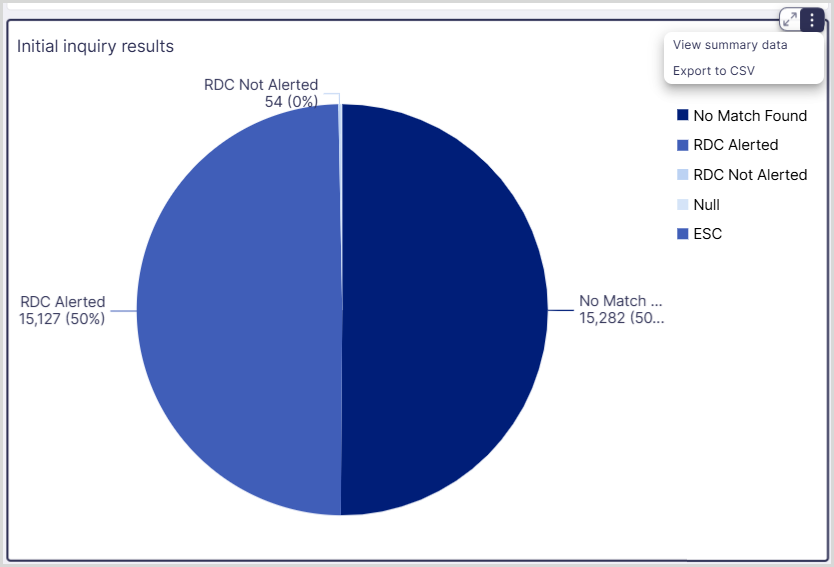
Selecting the Menu options dots opens additional controls that vary by report type.
Reports may include options to:
View a summary of the data in the report.
Export the data behind the report.
Manage expand/collapse controls within the report.
Customize heatmaps
You can tailor the sorting and visibility of data in Grid Reporting heatmap reports.
Select the gear icon in the heatmap report to open the Customize menu. This menu contains the data elements of the heatmap.
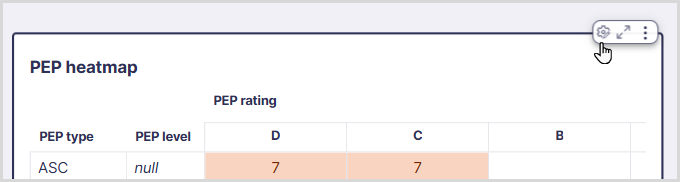
Select the three dots next to an element for options to adjust its behavior within the heatmap.
You can sort the heatmap rows and columns by an element, as well as hide and remove specific data.
For data values, you can hide and remove values, or customize their display.
Select the icon in the menu if you'd like to keep the Customize menu open while reviewing and interacting with the heatmap.
To exit the menu and return to the full heatmap view, select the .