About Grid View dashboards
Grid View dashboards are a suite of reporting and data visualization tools that provide on-demand data access and insights. See View Grid View dashboards and Data filters in Grid View dashboard reports for information on working with the data in these dashboards.
Dashboard data in Grid View is refreshed on an intra-day basis.
Account dashboards
Account dashboards display inquiry volume data across accounts or firms, providing insights to management and leadership who are responsible for trend monitoring, portfolio performance, and comparative analytics.
Account heatmap
The Account heatmap dashboard visualizes screening results. This dashboard uses the CVIP framework to plot the number of matches for each event and stage combination in a given period.
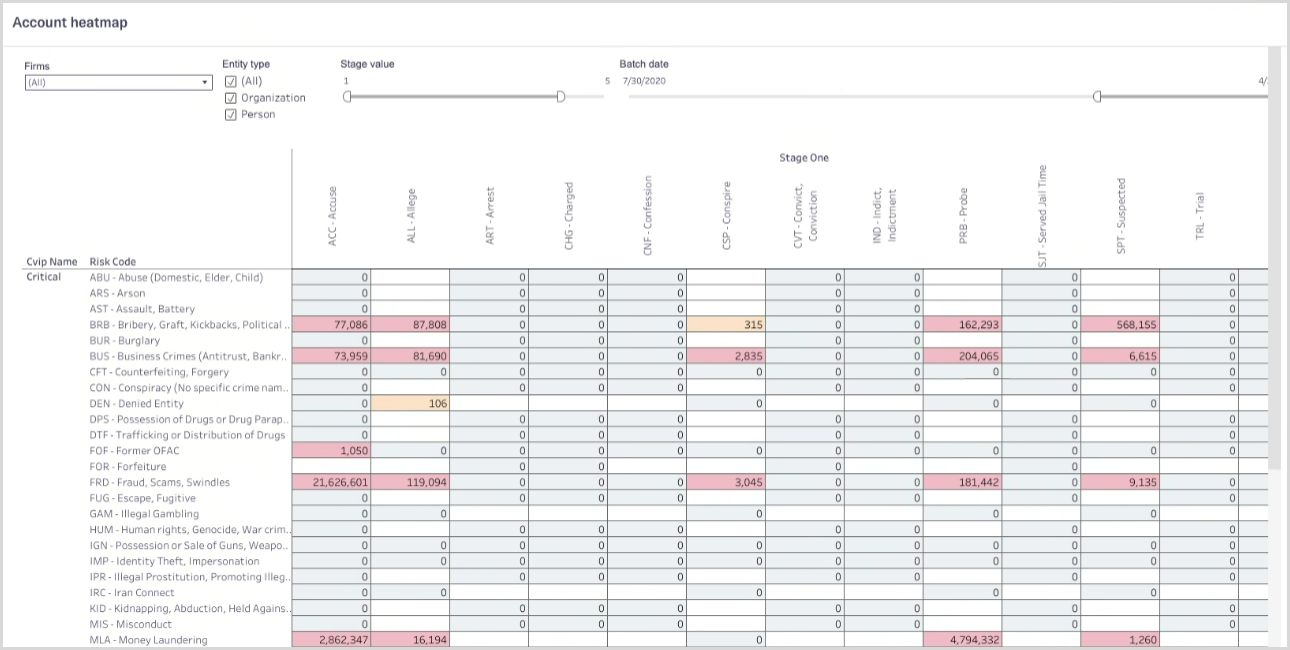
This data can help you identify data trends and analyze matches so that you can reduce false positives, adjust CVIP and filter settings, and improve overall screening efficiency.
Account stats
The Account stats dashboard provides visibility into overall Grid usage.
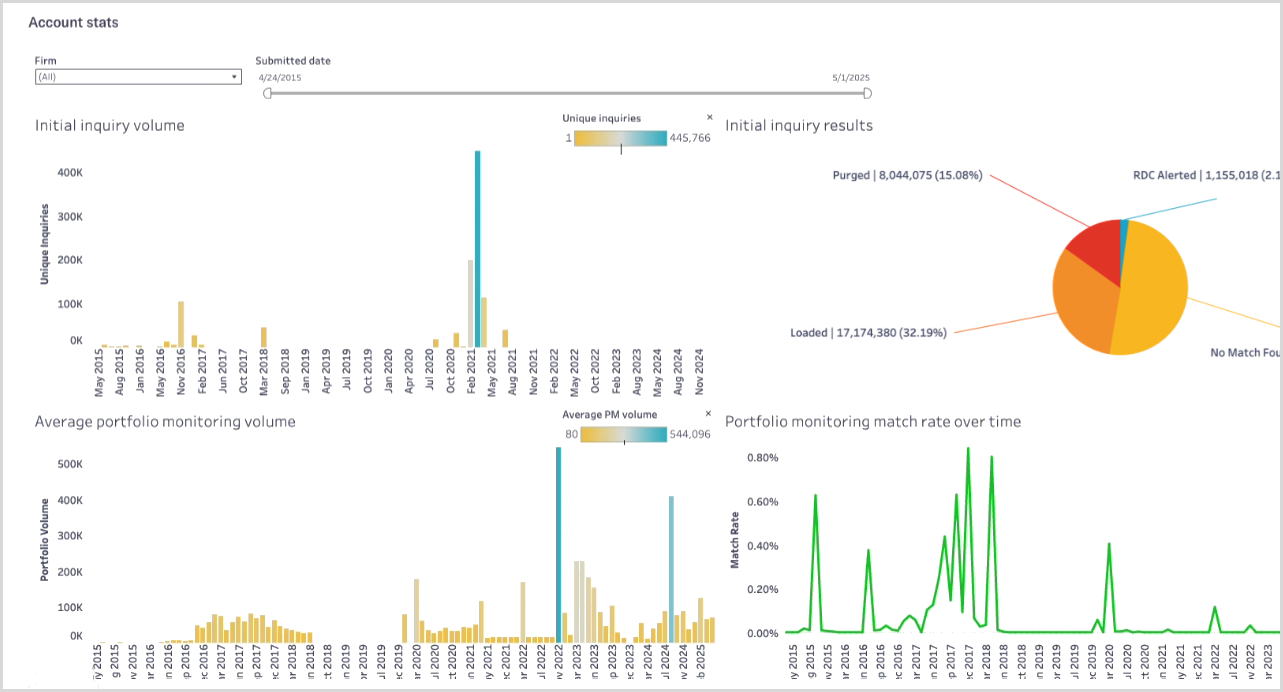
The reports in the Account stats dashboard are:
Initial inquiry volume: A bar chart showing the number of unique inquiries submitted in an account per month.
Initial inquiry results: A pie chart that breaks down inquiries by their current match status.
Average portfolio monitoring volume: A bar chart showing the average number of entities in your portfolio by month.
Portfolio monitoring match rate over time: A bar chart showing the match rate percentage in portfolio monitoring batches by month.
Initial inquiry alert rate: A pie chart of inquiries by iCAD alert status.
Portfolio monitoring alert rate: A pie chart of portfolio monitoring entities by iCAD alert status.
You can use this data to track trends in inquiry submission rates, match rates, and the number of entities in your portfolio. To avoid account overages, you can review your account’s usage against subscribed volumes and respond to emerging usage trends accordingly.
Operational dashboards
Operational dashboards provide data on submitted inquiries, allowing analysts and managers to access frequent updates on open items, review statuses, and user activities.
Open items dashboard
The Open items dashboard provides an at-a-glance summary of your firm or account's open reviews and the progress in clearing these reviews over time.
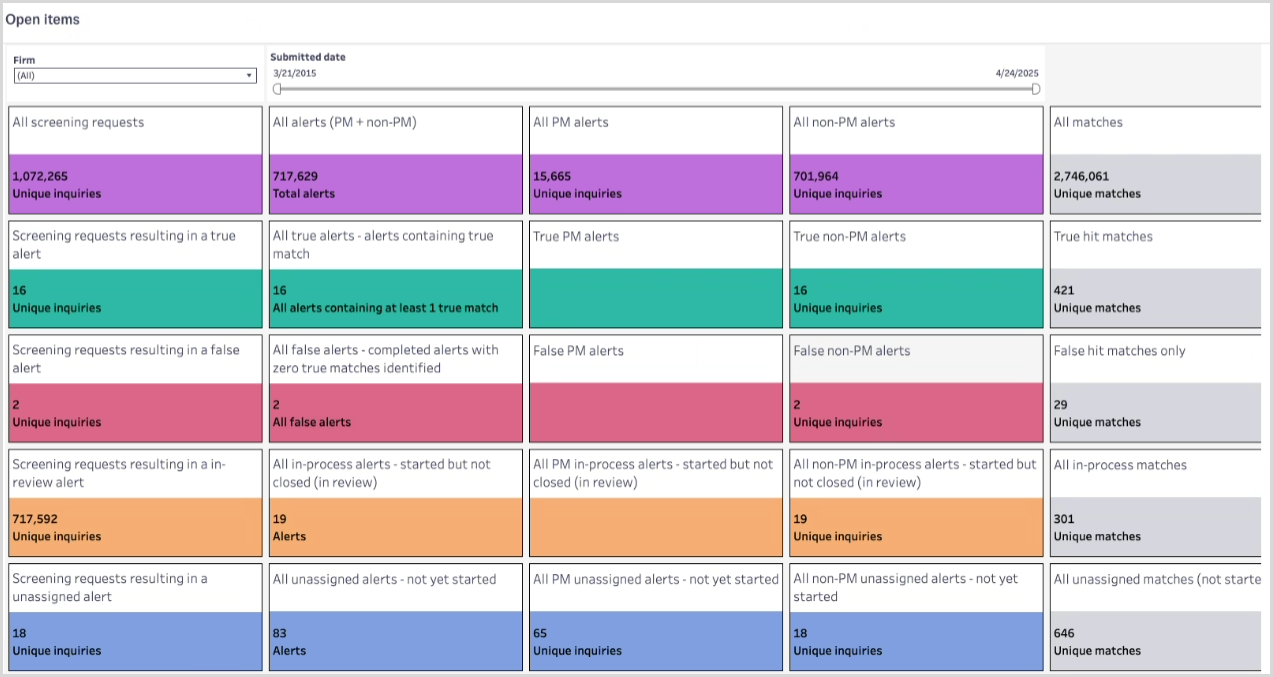
The top Open items report is a color-coded breakdown of submitted work and status. Data includes screening requests, matches, alerts, and unassigned work.
Other reports in the Open items dashboard are:
Reviews by iCAD review status: A bar chart by date of Unassigned, Assigned, or Complete reviews.
Initial inquiry pending reviews aging report: A bar chart of open inquiry matches by time since sent to iCAD review.
Portfolio monitoring pending reviews aging report: A report of open portfolio monitoring matches by time since sent to iCAD review.
Portfolio monitoring pending reviews in firm backlog (older than 7 days): A bar chart by firm of portfolio monitoring reviews that are pending review for more than seven days.
Portfolio monitoring matches pending review in firm backlog (older than 7 days): A bar chart by firm of portfolio monitoring matches that are pending review for more than seven days.
All unique inquiries and matches by day: A bar chart of inquiry and entity matches by day.
You can use this data to determine the number of items awaiting review, identify critical reviews to prioritize, assess workloads across teams, and track short-term trends in review volume, new inquiries, and Portfolio Monitoring.
Operational dashboard - review
The Operational dashboard - review provides up-to-date data on screening trends, with a focus on where matches are generated and how efficiently critical matches are reviewed.
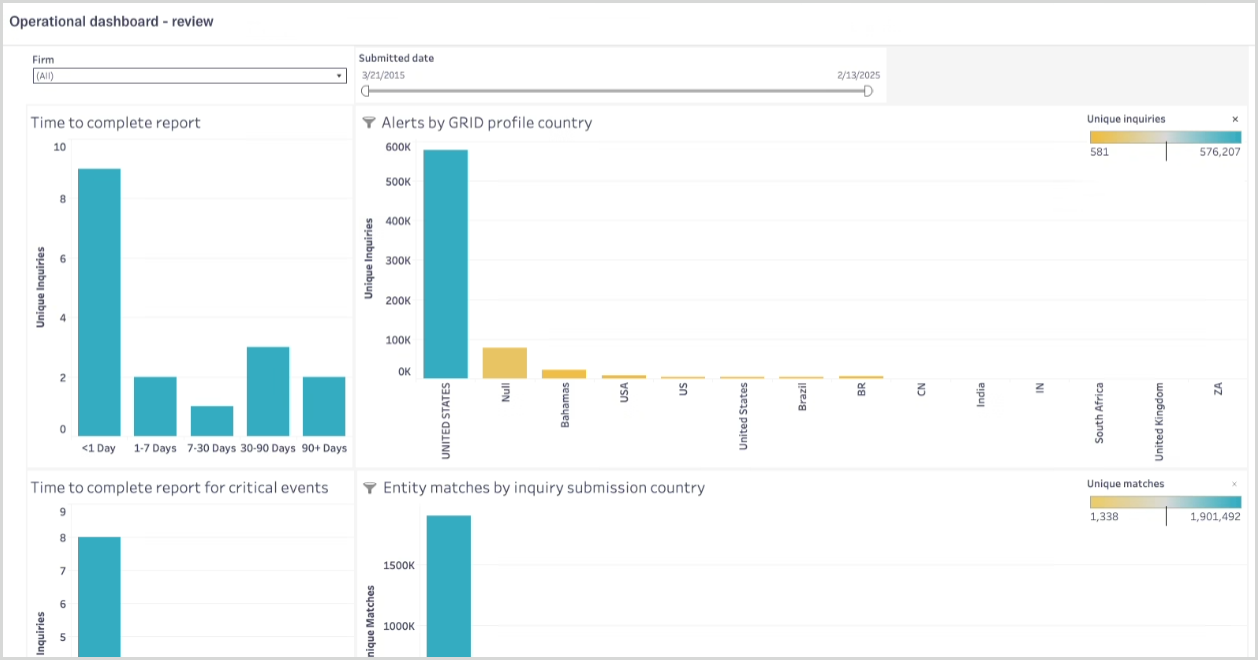
The reports in the Operational - review dashboard are:
Time to complete report: A report showing the number of reviews that were completed within specified time intervals.
Time to complete report for critical events: A report showing the number of reviews that were completed within specified time intervals.
Alerts by Grid profile country: A report in descending order of the countries in the matched entities.
Entity matches by inquiry submission country: A breakdown of how many matches are based on the country in the inquiry submission.
This data can help you track key metrics across accounts, firms, or groups of firms. This supports the prompt completion of critical reviews in compliance with regulatory requirements.
Operational dashboard - user
The Operational dashboard - user tracks analyst activity and the time it takes analysts to complete entity matches and reviews.
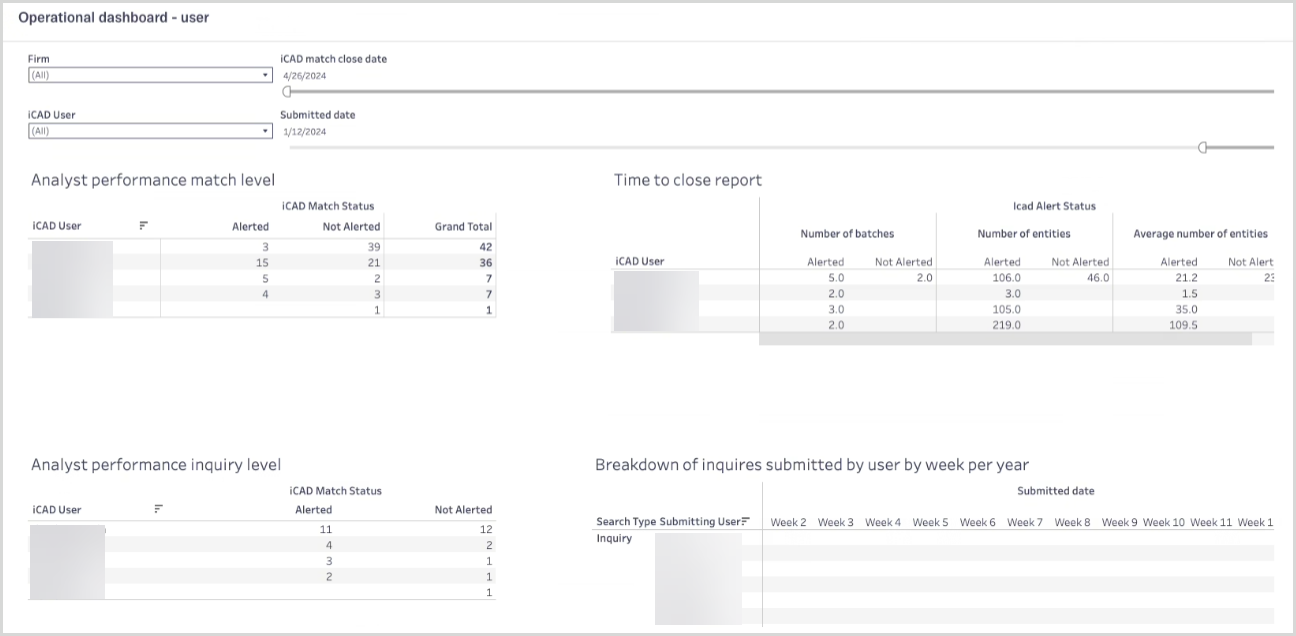
The reports in the Operational - user dashboard are:
Analyst performance match level: A table showing how long individual analysts take to complete each entity review.
Time to close report: A table reporting individual analysts' time to close iCAD reviews.
Analyst performance inquiry level: A table showing how long individual analysts take to complete an inquiry review.
Breakdown of inquiries submitted by user by week for year: A table showing the number of inquiries individual analysts have submitted each week in the past year.
This data provides insight into the performance of your analysts, enabling you to ensure that work is completed efficiently and effectively, facilitate timely follow-up on outstanding items, and prioritize resources and training.
PEP heatmap
The PEP heatmap uses your Grid screening results to plot the number of matches for each PEP type, level, and rating combination in a given period.
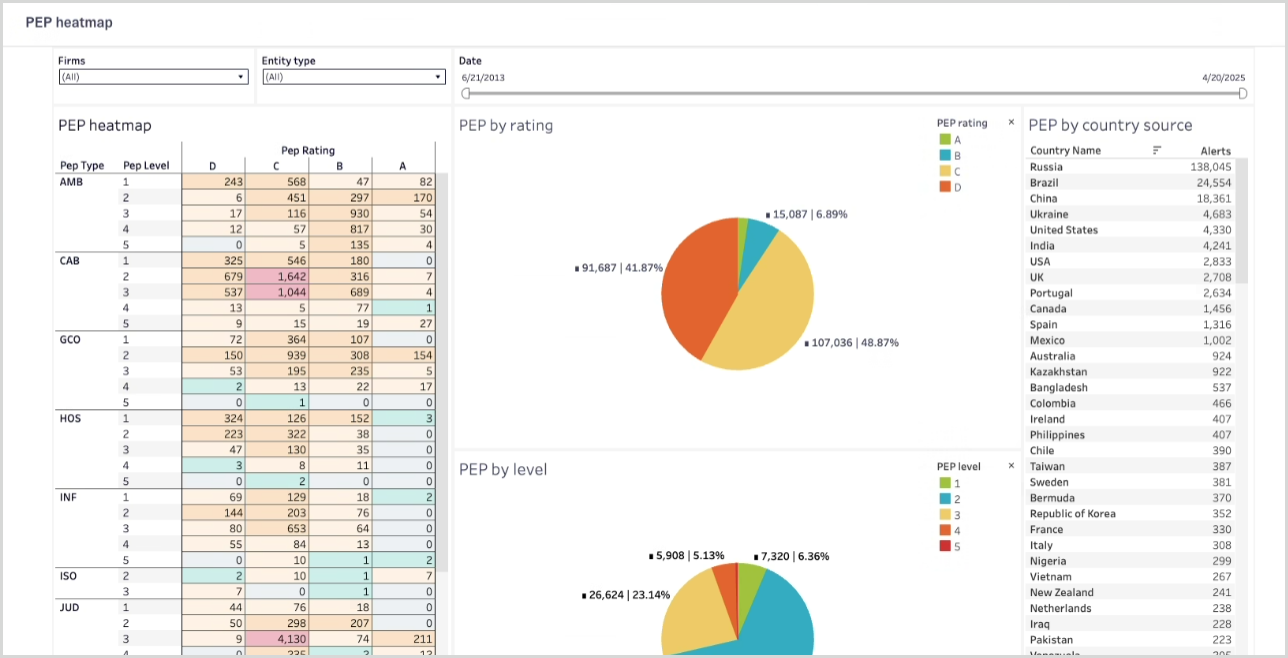
Reports in the PEP heatmap are:
PEP heatmap: A color-coded table of matching entities for each PEP Type, PEP Level, and PEP Rating.
PEP by rating: A pie chart that breaks down match PEP types.
PEP by rating: A pie chart that breaks down match PEP levels.
PEP country by source: A table listing the countries generating PEP matches.
This data enables you to review specific PEP entities and sources, identify which are generating matches, and adjust filters to reduce the amount of manual effort required to clear matches.