About Grid Reporting
Grid Reporting includes dashboards for inquiry volume, match events, review status, user activity, and PEP matches. It also provides data export capabilities with filters to tailor data to your needs.
Grid Reporting is a self‑service reporting tool that helps you review and monitor your most important Grid screening and operational data. It provides visual dashboards and data export tools so you can quickly see patterns, answer questions, and make informed decisions.
Reporting dashboards
Grid Reporting dashboards provide interactive views of screening activity. You can filter and tailor dashboard views to work for both daily monitoring and long-term analysis.
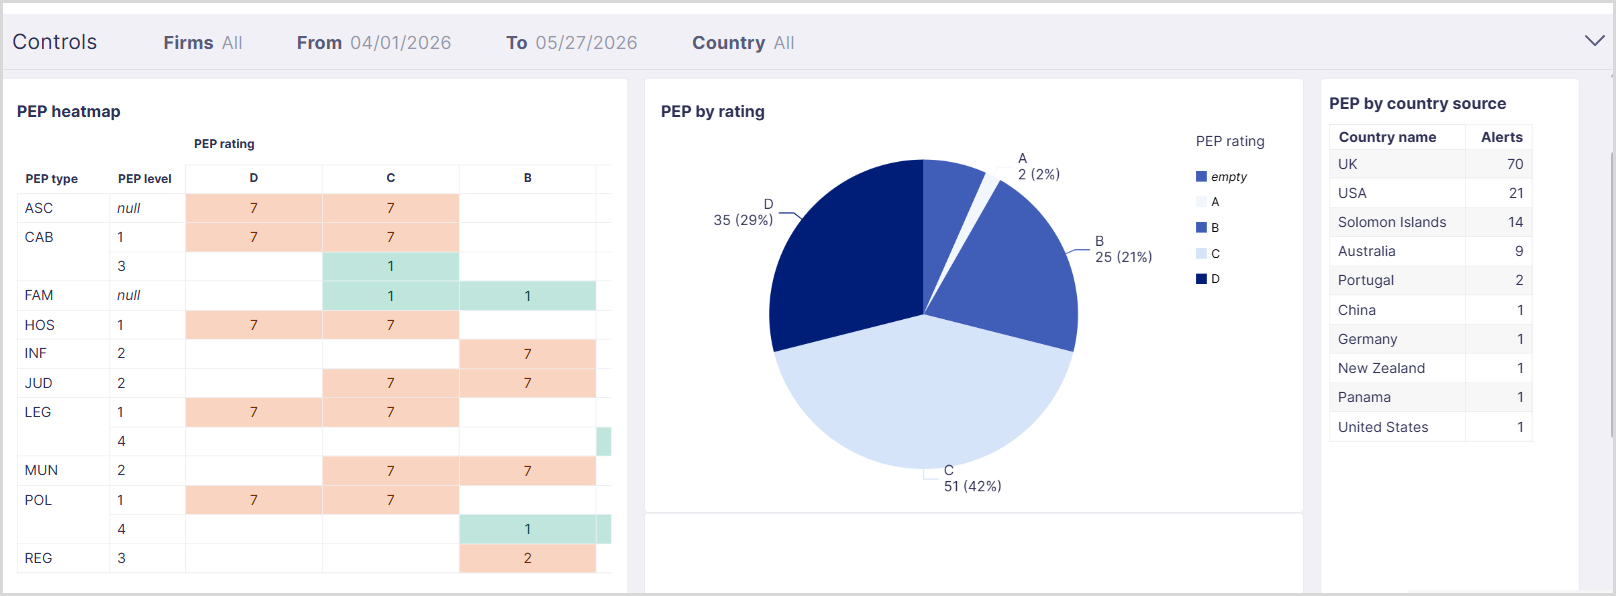
For details about the information available in Grid Reporting dashboards, see the Grid Reporting dashboards and reports topic.
Your company must subscribe to Grid Reporting dashboards to access these features. For more information on adding this capability, contact your Moody's representative.
Data export
The Grid Reporting data export tool provides on‑demand access to screening and operational data. Preconfigured export types provide quick access to commonly used datasets, while customization options help you generate exports that meet your analytical or operational goals.
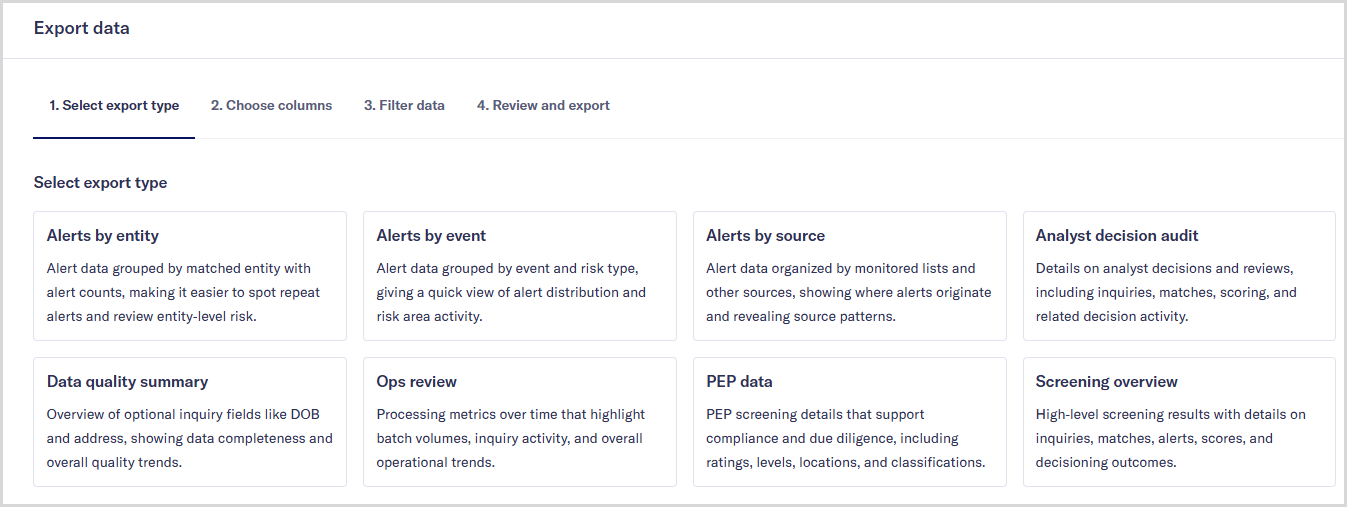
Grid Reporting export CSVs are delivered as ZIP files that you download from the screen. This screen also provides an audit trail of past exports, including export type and timestamps.